Property cycle
Compare recorded prices with a suburb’s long-term exponential trend.
Explore recorded NSW sales from 1990 onwards. See cycles, local variation, and changing density before bringing property back into the wider household picture.
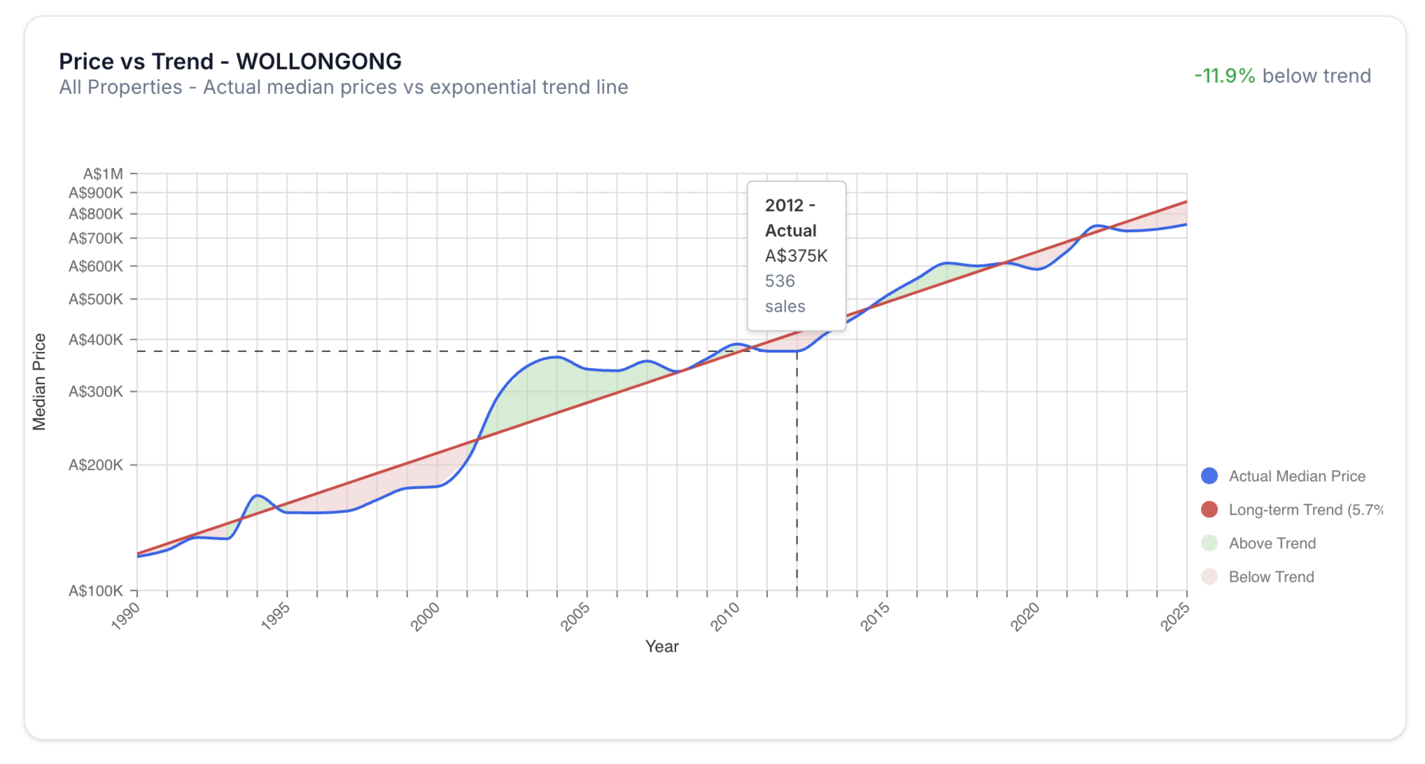
No sign-up is required. Each link opens the live property interface with the selected suburb loaded.
Each view answers a narrower factual question. None ranks a property for you or tells you what to buy.
Compare recorded prices with a suburb’s long-term exponential trend.
Rank streets by compound annual growth using the available sales history.
Compare price-per-square-metre movement across houses and apartments.
Inspect sales, transaction patterns, and median movement at street level.
See how the mix of houses and units changes through time.
Review historical transaction activity rather than relying on anecdotes.
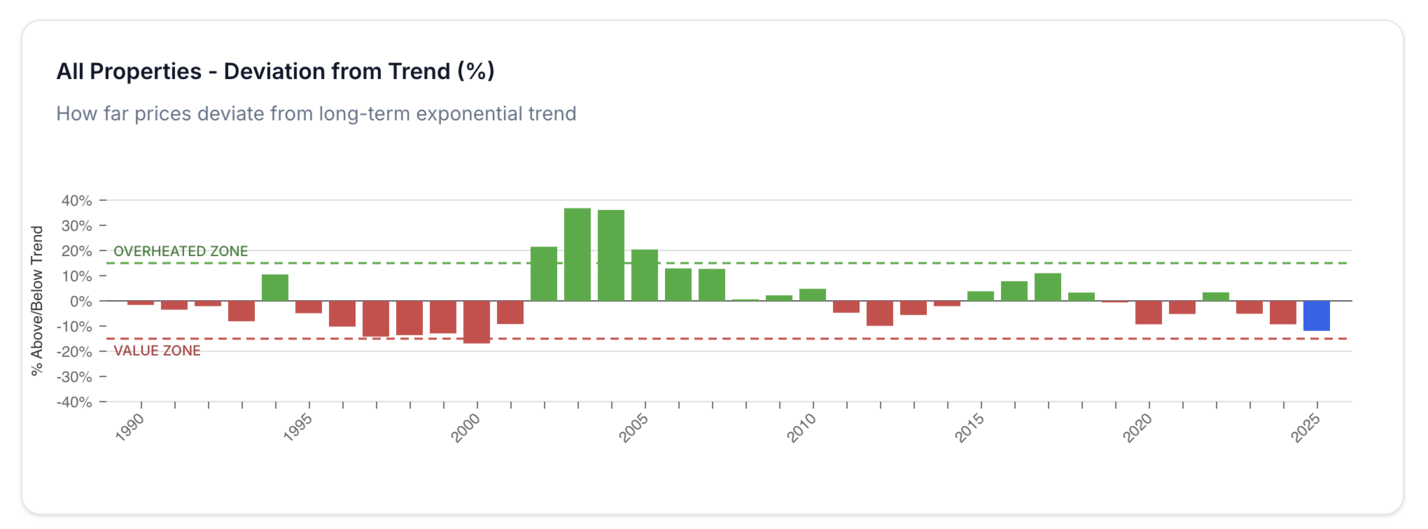
Positive or negative deviation describes where recorded prices sit relative to the fitted historical trend. It does not establish that a place is cheap, expensive, suitable, or likely to move in a particular direction.
Explore the live dataTrack property alongside cash, investments, liabilities, income, and expenses. Then use the full snapshot as the starting position for a future scenario.
Analytics use NSW Valuer General Property Sales Information from 1990 onwards. Sales below $10,000 or above $100 million are excluded as anomalies. Street rankings require at least five sales across at least three years.
Read about wealth tracking